Holografia a jej technické aplikácie
3.4.1.3 Results and Discussion
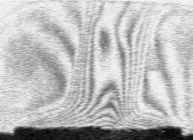
The experiment had dynamic course, the individual patterns changed relatively quickly. Advantageous was the application of CCD camera that works immediately and makes the records in the form of bmp files.
During the heat loading of the test specimens in the first phase the heat transmits and consequently the wood mass gradually degrades. Close above the test specimen surface a thermal marginal layer is created where it is possible to investigate the interference fringes.
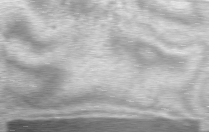
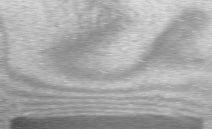
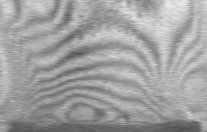
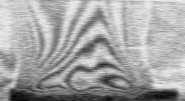
In Fig. 3–62 a–d
holographic interferograms of the temperature field above the heated
test specimen recorded at the surrounding temperature
of 17° C
(290 K) and the pressure of 98 000 Pa are displayed.
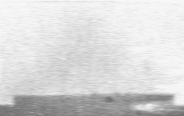
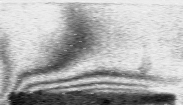
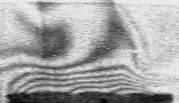
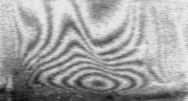
Fig. 3–62 Holographic interferogram of the temperature field of the horizontal wood specimen (poplar – parallel direction) recorded at the interferometer adjusted to the infinite fringe width
a) before the experiment (without heating)
b) during the experiment (beginning of heating – after 3 minutes of heating)
c) during the experiment (heating – after 7 minutes of heating)
d) at the end of the experiment (glowing or fire-through of the test specimen)
The heat transmits through the test specimen of the thickness of 10 mm. In the figures the balanced increase of the thermal marginal layer thickness is visible. In larger distance from the test specimen a chaotic fringe distribution occurs. The interference fringes represent the isothermal curves of the temperature field. In the figures the individual characteristic interference fringes are distinct as the refractive index is changing. It is because the test specimen is gradually heated also on its upper side and the higher is the temperature the more fringes are created. For individual fringes the relevant temperatures are possible to calculate.
The last of the displayed holograms (Fig. 3–62 d) was recorded at the moment of glowing of the test specimen.
In some figures the flash after the fire-through is seen whereas we can observe the gradual transformation of the thermal marginal layer into the rising column of heated air.
We can determine the exact place where the body fire-through occured. The temperature field has the characteristic shape at this moment.
During the experiments it was possible to observe the succesive fringe formation (Fig. 3–63):
|
|
|
|
|
(Po1lo_13m) |
(Po8lo_8m) |
|
Note: The names of the holographic interferograms of the temperature fields of heated test specimens have the following meaning:
WoodSpeciesNumberDirection_HeatingTime
For example: Po1lo_13m:
Po – poplar (Sp – spruce)
1 – number of the test specimen
lo – longitudinal direction (ra – radial)
13m – 13 minutes of heating
Typical shapes of interference fringes during the heating of the test specimens
During the experiment the formation of typical shapes of the interference fringes was possible to observe. The individual types (Pivarčiová, 2002) are displayed in Fig. 3–64.
Considering the effort to keep the times with the periods defined in advance (1, 3, 7 minutes) the shapes of the interference fringes in some interferograms are difficult to interprete in the particular time.
Each interference fringe represents a temperature increase.
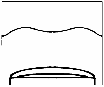
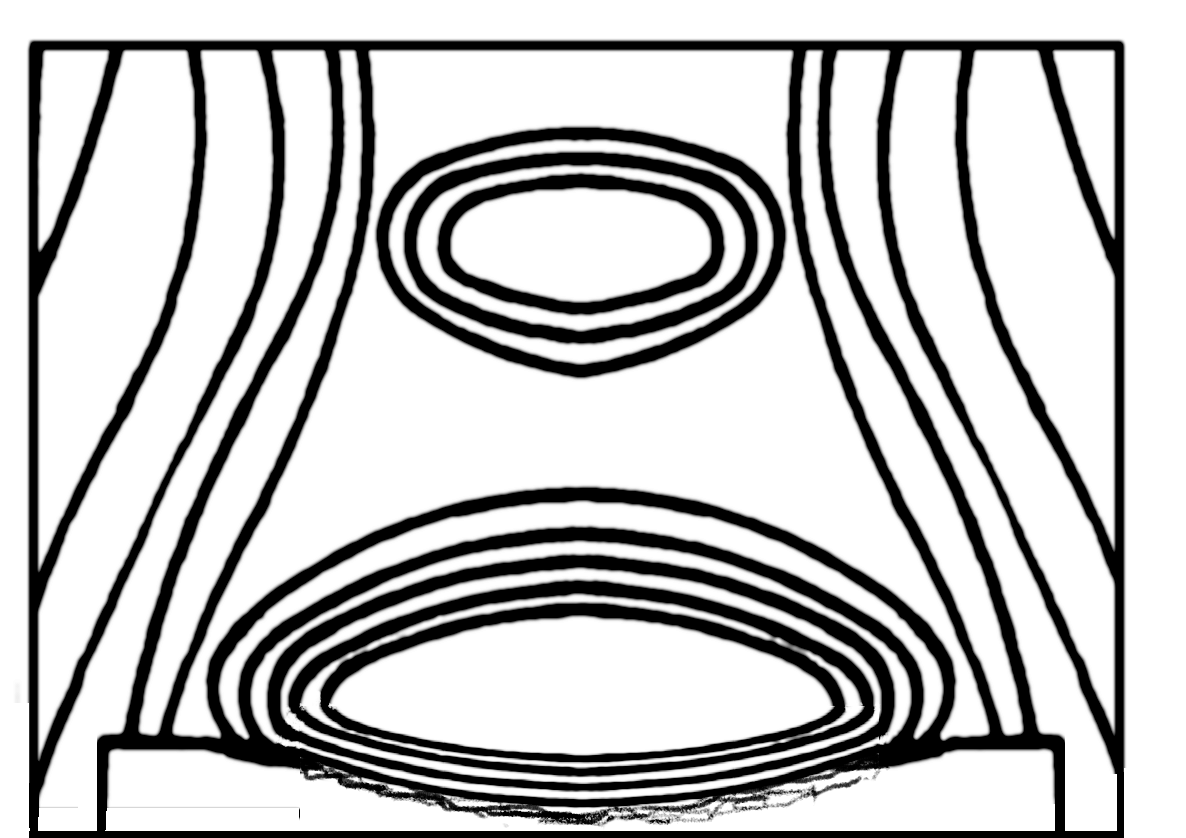
Immediately before the fire-through the interference fringes with closed curves were created (Fig. 3–64 h) with no possibility of temperature determination. These holograms do not fit into the system of analysis. The created patterns were very complex and involved closed curves. The interference fringes on the holograms are too rich to be quantitatively analysed.
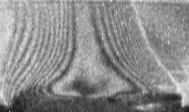
Neither the holograms with chimney effect obtained after the fire-through of the test specimen (Fig. 3–64 i) were possible to analyse. The temperature field has its typical shape created by penetrating inflammable gases and hot fumes. We can see that the originally almost horizontal fringe course is changing into a vertical one. The fringes have almost horizontal course, especially in the upper part.
|
|
|
|
|
|
|
|
|
|
|
|
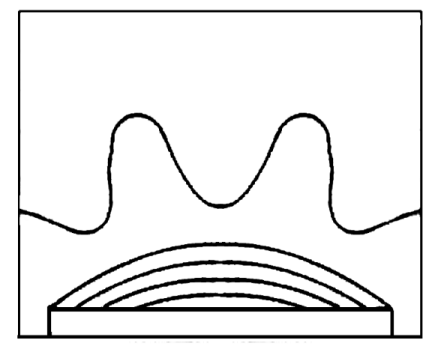
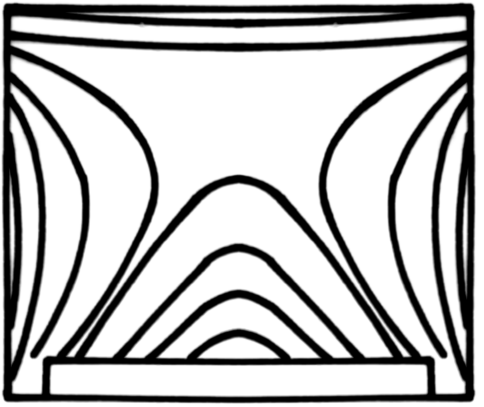
a) Small number of interference fringes –beginning of heating
b) Larger number of interference fringes – heating
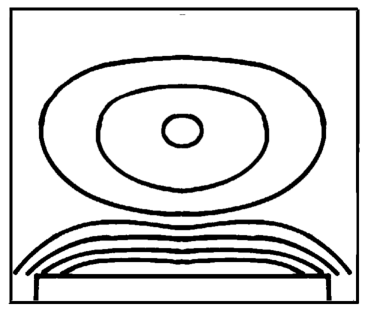
c) tongues – initial state before the bubble
d) bubble – influence of the local natural convection in the measuring space above the test specimen
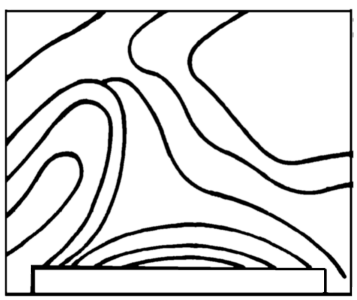
e) additional interference fringes – if the test specimen dimensions were not observed with respect to the aperture on the measuring platform
f) waves – influence of the flow
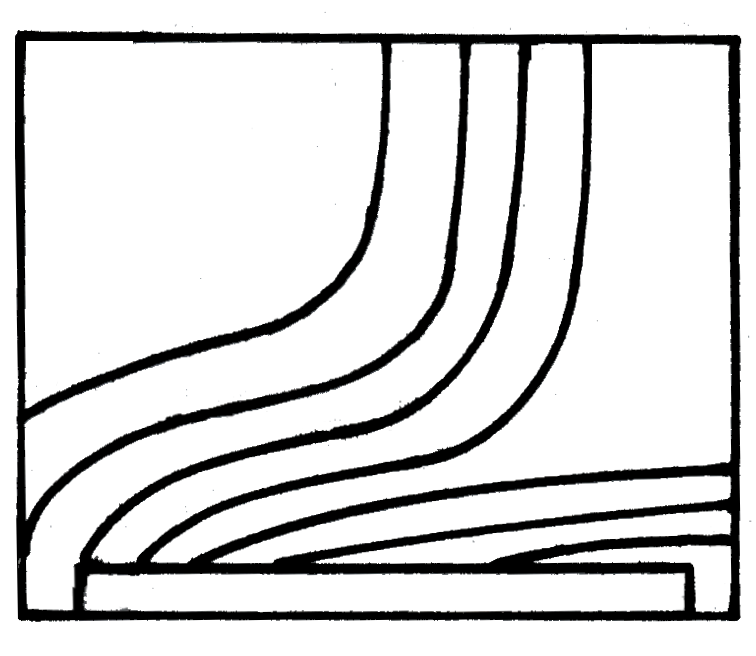
g) interference fringes with closed curve
h) complex patterns with closed curves – immediately before the fire-through of the test specimen
i) chimney – after the fire-through of the test specimen
During the experiment we found out that the temperatures tend to change under the influence of disturbing conditions of the surrounding (changes caused by different temperatures in the measuring space and outside it). The most objective are the values close above the test specimen surface: the larger the distance from the specimen surface the more intensively the external influences act.
As seen in the figures, the shapes of the interference fringes were influenced by surrounding conditions in the laboratory, for example the heat exchange between the measuring space and the surrounding:
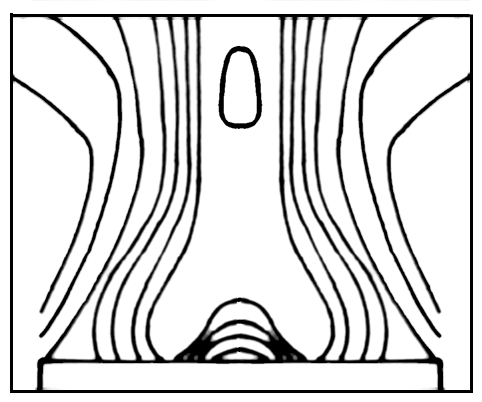
The local natural convection in the measuring space above the test specimen caused by mixing of the warmer air coming from the test specimen and the cooler air in the surrounding occured in a certain distance above the test specimens where the thermal gradient was lower. This caused the formation of "bubbles" (Fig. 3–64 d). Close above the test specimen the thermal gradient was high. In the area where the thermal gradient was decreasing a bubble was created. During the observation in real time opening and closing of the bubble happened, which was caused by free convection. The original state of the "bubbles" were the "tongues" (Fig. 3–64 c).
The air convection in
the laboratory – the air in the places where the
experiments were carried out was warmer than in more distant parts of
the laboratory interior, which caused the formation of the "waves"
(Fig. 3–64 f).
Although we could logically expect that temperature above the test specimen would be the highest in its centre, i.e. directly above the flame of the point source, while the temperatures above the boundaries will be lower, such a temperature interpretation was proved only in some cases.
Investigation of the holograms showed that in most cases it was not clear where the temperature was the highest as the number of fringes in the centre of the test specimen as well as on its boundaries was equal, which means that their temperatures were equal, too, but in different heights above the test specimen. It is because the dimensions of the test specimen were small and the temperature quickly spread over the whole surface of the test specimen. On some test specimens we found out that the highest temperatures were not in their centres but the fringes were displaced. The temperature variations were obviously influenced by the structure of wood, dimensions of the test specimen and effects from the surrounding.


