Time_Averaged_Method
3.1.2.1 Time Averaged Method
The time averaged method represents the basis of the holographic interferometry of moving objects. Its most suitable and also most frequently used application field is the research of mechanical vibrations of diffusively reflecting objects. This application is also the historically oldest technique of holographic interferometry (Powel, Stetson, 1965).
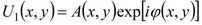
In the theoretical and physical interpretation of the time averaged method we consider any object on which the light wave is incident. We can express the complex amplitude U1(x) of the light wave in the plane of the hologram (x, y) dispersed by the object surface at rest, by (Vest, 1979):
 , (3.1)
where A(x, y) is the amplitude of the light wave.
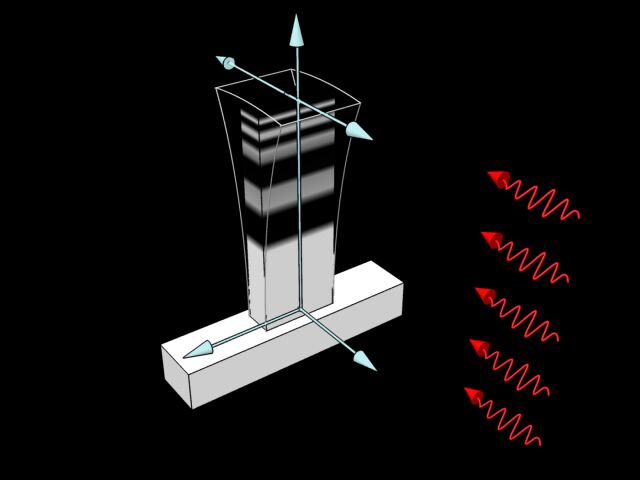
(displacement passes in +z axis direction, illumination in –z axis direction)
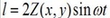
If the distance from the object to the hologram is large, we can assume that the light beam which in the case of the fixed object travels the distance l from the source to the object surface and to the hologram will in the case of the oscillating object travel the distance as follows:
 .
(3.2)
.
(3.2)
where Z(x, y) is the amplitude of mechanical vibrations in points x, y on the object surface. To this corresponds the change of the Δφ light wave phase that is equal to:
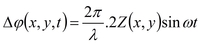 . (3.3)
Considering the phase change in the given moment, for the complex amplitude of the light wave in the plane of the hologram the following expression is valid:
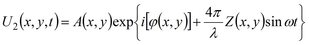 . (3.4)
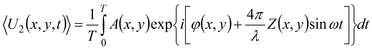
During exposure time T the object wave U2 (x, y, t) and off-axis reference wave UR are recorded on the hologram. After photochemical processing we illuminate the hologram with the reference wave. Then the complex amplitude of the reconstructed wave will be proportional to the average time value of U2(x, y, t) during exposure time T. For its time average value is valid:
 . (3.5)
and after modification, considering relations (3.1), (3.3) and (3.4) we receive
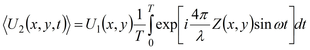 . (3.6)
The value of the function after the integral in (3.6) relation is according to Vest called the characteristic function of relevant time function MT (Vest, 1979).
Intensity of illumination I(x, y) can be expressed by the formula:
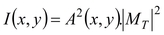 .(3.7)
Taking into account that the exposure time in comparison with the oscillation period is high (T»2π⁄ω) then after modification is valid:
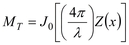 . (3.8)
where J0 is Bessel function of the first kind and zero order. The relevant intensity of illumination in the reconstructed image is proportional to the square of this function:
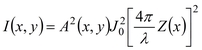 . (3.9)
From formula (3.9) it follows that the reconstructed image is modulated by a system of interference fringes, characterised by the square of the Bessel function of zero order. The midpoints of dark fringes merge with such points of the surface and with such vibration amplitude Z(x) where Bessel function obtains zero values.
The occurred system of interference fringes is characterised by the fact that the resolution of the fringes (in certain cases also the distance between them) decreases with the increase of the interference order. The result is that the efficiency is most frequently limited by the highest order of the interference fringe that is still differentiable during the reconstruction of the holographic interferogram.
The time averaged method is used to study the resonance vibration shapes of machine parts of various shapes and surfaces if their vibrations are unfavourable and can lead to deterioration of the part itself (Božek, Dragúň, 1996) or of the whole machine unit (vibrations of saw blades). The time averaged method, however, offers valuable information also for the cases where the oscillation is desired. Here also belongs the research of resonance shapes of string musical instruments resonators.
The exposure time for the holographic interferogram recording by the time averaged method is longer than the period of harmonic oscillating movement of the investigated object. The places with maximal and zero oscillation amplitude are visible at first sight. The image of the investigated object, reconstructed from the holographic interferogram is covered with a system of interference fringes. When studying harmonically oscillating objects, these fringes map the oscillation shape. The brightest fringes correspond to nodal lines; the dark ones represent the oscillating parts of the object.


