Holografia a jej technické aplikácie
3.4.1.2 Description of the Experiment
The study of many physical processes will be more simple if we manage to visualise them. For observation of temperature fields the real-time holographic interferometry method was chosen as it offers (through recording of the refractive index field of the investigated environment), an integrated image about the size and shape of the temperature field in the time given, with the possibility of further analysis and interpretation of the investigated phenomenon. The method does not require the presence of any mechanical sensors (for example thermo-elements, various miniature sensing heads) in the measuring space and, therefore, the measurement itself is not influenced by state parameters. Another advantage of this real-time method is the possibility of full-time recording of the process from the beginning of heating of the test specimen till its flash.
The aim of this experiment was to obtain new knowledge about thermal properties of wood in various anatomical courses, mainly time dependences, thermal flow through the test specimen and the complex image of the temperature field till the flash using new laboratory holographic interferometry as well as computing technologies (Pivarčiová, 2002).
The principle of this visualisation method is based on the fact that under the influence of heating the test specimen surrounding represents an optical inhomogenity. Under constant pressure the relative gas density changes directly proportionally to the temperature change. As the refractive index of the surrounding is the function of its density the processes connected with the change of temperature are characterised by the change of refractive index, which is consequently manifested by either the change or the formation of interference fringes. The light wave that passes through such a transparent environment is deformed.
The interference method is based on identification of the change of light wave phase. From the phase change the refractive index distribution is determined. The environment whose temperature is higher than that of its surrounding has also different density and therefore different refractive index than the surrounding. Determination of the refractive index value in various points of the surrounding enables us to determine its density and thereby also its temperature.
For investigation of the temperature fields the test specimens with dimensions of 43 × 40 × 10 mm in three various anatomical directions (longitudinal, radial, tangential) were used. As the source of heating a point source was used in the distance of 18 mm from the test specimen.
Interferometric visualisation of the temperature fields was mainly aimed at the thermal marginal layers close above the test specimen surface.
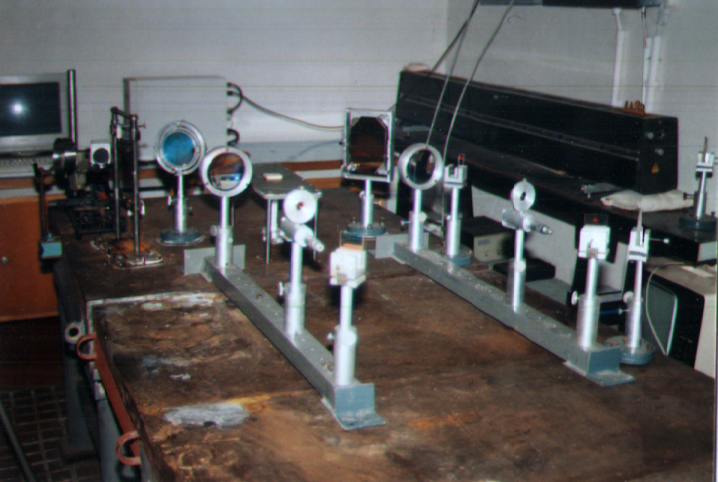
For visualisation the Mach-Zehnder interferometer adjusted to infinite fringe width (Fig. 3–61) was used.