Evaluation_Formulae
3.2.1.1 Evaluation Formulae
The axial deviation of the saw blade induced by asymmetric oscillation can be described by the following formula:
 ,(3.36)
or
 ,(3.37)
where x0(r) – amplitude of forced oscillation as a function of the strained point from the saw blade centre [mm],
ωs = 2.π.fd – circular frequency of radially propagating wave,
ωn = 2.π.fn – circular frequency of the saw blade,
n – number of the saw blade revolutions,
t – time,
φ – phase constant,
k – number of nodal averages (k = 2, 3, 4, …),
fd – dynamic frequency of the saw blade [Hz],
fn – basic frequency of the saw blade oscillation [Hz].
Asymmetric
waves can propagate in two mutually opposite directions, either
rotationwise or counter-rotationwise.
The velocity increase of these waves in the rotating system can be
expressed by ratio
 that was observed as stable in relation to the saw blade (Siklienka,
Svoreň, 1997). On the other hand, the absolute
angular velocities in the stationary system (relative) are expressed
by
that was observed as stable in relation to the saw blade (Siklienka,
Svoreň, 1997). On the other hand, the absolute
angular velocities in the stationary system (relative) are expressed
by
 for
the wave propagating counter-rotationwise and the absolute angular
velocities are expressed by
for
the wave propagating counter-rotationwise and the absolute angular
velocities are expressed by
 for the wave propagating rotationwise.
The frequencies of these waves can be calculated by the following expressions:
 ,(3.38)
and for:
 ,(3.39)
where f1 – frequency of the wave propagating rotationwise,
f2 – frequency of the wave propagating counter-rotationwise
The resonance state comes if the multiple of excitation frequency is equal to frequency f1 eventually f2, while the excitation frequency of the saw blade rotation is equal to frequency fn.
On the basis of the above information, the dynamic inherent frequency of the saw blade is determined by the following expression:
 ,(3.40)
λ is a factor depending on both the oscillation shape and the clamping ratio. For non-modified saw blades it is λ = 1.5.
In consequence of the above mentioned cyclic axial loading, an excessive increase of the strain occurs on the bearing located closer to the saw blade, which is confirmed also by the maintenance practice.
To the negative consequences of saw blade resonance oscillation belongs the apparition of fatigue cracks in the gullet, noisy running, axially and radially excentric running of the saw blades resulting in wider cutting gap and, moreover, the electricity consumption is increased, too. Therefore, great effort is made to investigate these phenomena by applying new modern methods that make it possible to analyze the dynamic behaviour of saw blades. Propre application of the results obtained at construction of saw blades as well as at the cutting process can reduce the risk of damage and increase their durability.
If during the exposure time the object recorded on a hologram performs a harmonic motion, then during the reconstruction the average time value of the object wave appears. In one of the first works published on holographic interferometry Powell and Stetson introduced the method of vibration analysis (Powell, Stetson, 1965).
The brightest fringe in this pattern merges with the nodal area, i.e. with those places on the object surface that do not move during the oscillation. Besides the bright nodal fringes in the holographic image other fringes can be observed, each one corresponding to the geometric position of the points oscillating with equal amplitude.
An example of this process is the vibration of the disc whose surface regularly moves in the rhythm of sinusoidal oscillation round the equilibrium position. The imediate deviation of each point in the direction along with the z-axis is characterised by time function:
 ,(3.41)
where dz – amplitude of mechanical oscillations,
⌊⌋ – angular frequency of oscillations.
Path difference ⌊⌋(x, t) of the light beam is given by expression:
 ,(3.42)
while for this difference the following expression is valid:
 ,
(3.43)
,
(3.43)
where φ – angle of incidence of the light beam,
ψ – angle of reflection of the light beam (toward the observer).
By application of phase difference:
 ,(3.44)
the complex amplitude
of the light wave will have the form
 .
.
For illumination intensity in the reconstructed image the following is valid:
 ,(3.45)
and furthermore:
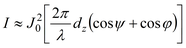 ,(3.46)
where J0 is Bessell function of the first kind and zero order.
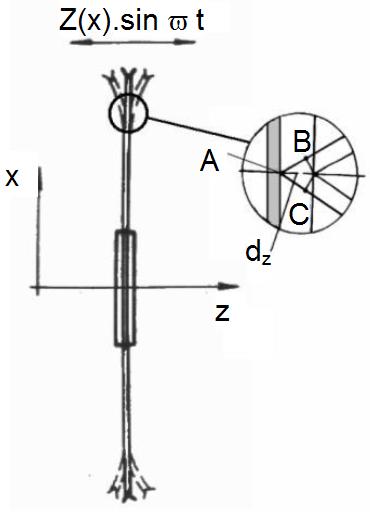
dz – amplitude of mechanical oscillations, A, B, C – points on the disc surface for derivation of the formula, x, y – coordinate axes
On the basis of the previous formulae we can derive the following equation for deviation dz:
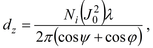 ,(3.47)
where Ni( )
is i-th zero order of quadrate of Bessel function
)
is i-th zero order of quadrate of Bessel function
 ,
,
⌊⌋ – wavelength of the used light.
Formula (3.47) enables us to determine – from measurable values ⌊⌋ , φ, ψ and from the table values Ni(J02) (Vest, 1979) – the values dz necessary for the analysis of reconstructed interferograms.


