Holographic Interferometry of Transparent Objects
3.3 Holographic Interferometry of Transparent Objects
The research of transparent inhomogenities (thermal, concentration, or other fields in transparent fluids) is most frequently carried out by interferometric method that makes it possible to visualise the inhomogenities in fluids thanks to their different refractive indices (Ostrovskij et al., 1977).
The interference methods of phase objects research are based on mutual acting of two coherent waves one of which is deformed by passing through an optical inhomogenity while the second one passes through an optically undisturbed area. Then, on the ground-glass screen we can see alternating maxima and minima of the light intensity, the interference fringes, from which we can identify the changes of refractive index in the researched area.
From the records obtained the direct qualitative evaluation of the studied event is usually possible. For quantitative analysis of holographic images it is necessary to determine the distribution of the refractive index within the object at first, and then calculate the distribution of the measured physical values from it. The refractive index distribution is possible to determine from either the change recorded on the interferogram or from creation of the interference order (Kubošek, 1989), (Trollinger, 1996).
The most frequently used holographic-interference techniques (see chapter 3.1.2) in investigation of transparent objects are: the real-time method and the double-exposure method.
Hauf, Grigul (Hauf, Grigul, 1970) and Panknin (Panknin, 1977) presented the possibility of Mach-Zehnder interferometer application for the study of heat and mass transmission on various models. They also described the methods of holographic interferogram analysis. Applications of holographic interferometry for transmission phenomena observation are also dealt with in papers by Vest (Vest, 1979), Černecký dealt with temperature fields visualisation in aerodynamics of the conventional wood drying process (Černecký, 1992). Urgela and Lupták observed the temperature fields above metal test specimens of various geometric shapes (Urgela, Ľupták, 1992), Pavelek, Janotková, Ramík, Liška dealt with possibilities of holographic interferometry application at the visualisation of thermal marginal layers at natural convection in the air and with possibilities of visualisations of dynamic temperature fields (Pavelek et al, 1976), (Pavelek et al, 1977), (Liška, 1988), (Pavelek et al, 2001). Also papers by Zemánek (Zemánek, 1984) et al. deal with the problems given.
For more efficient utilization of interferometry in research as well as in practical applications the analyses and evaluations of the interferograms of transparent inhomogenities (Pavelek et al, 1977), (Kepr et al, 1996), (Pavelek, Janotková, 1997) were started.
In Fig. 3–52 the influence of the phase object (1) in a specific plane is displayed.
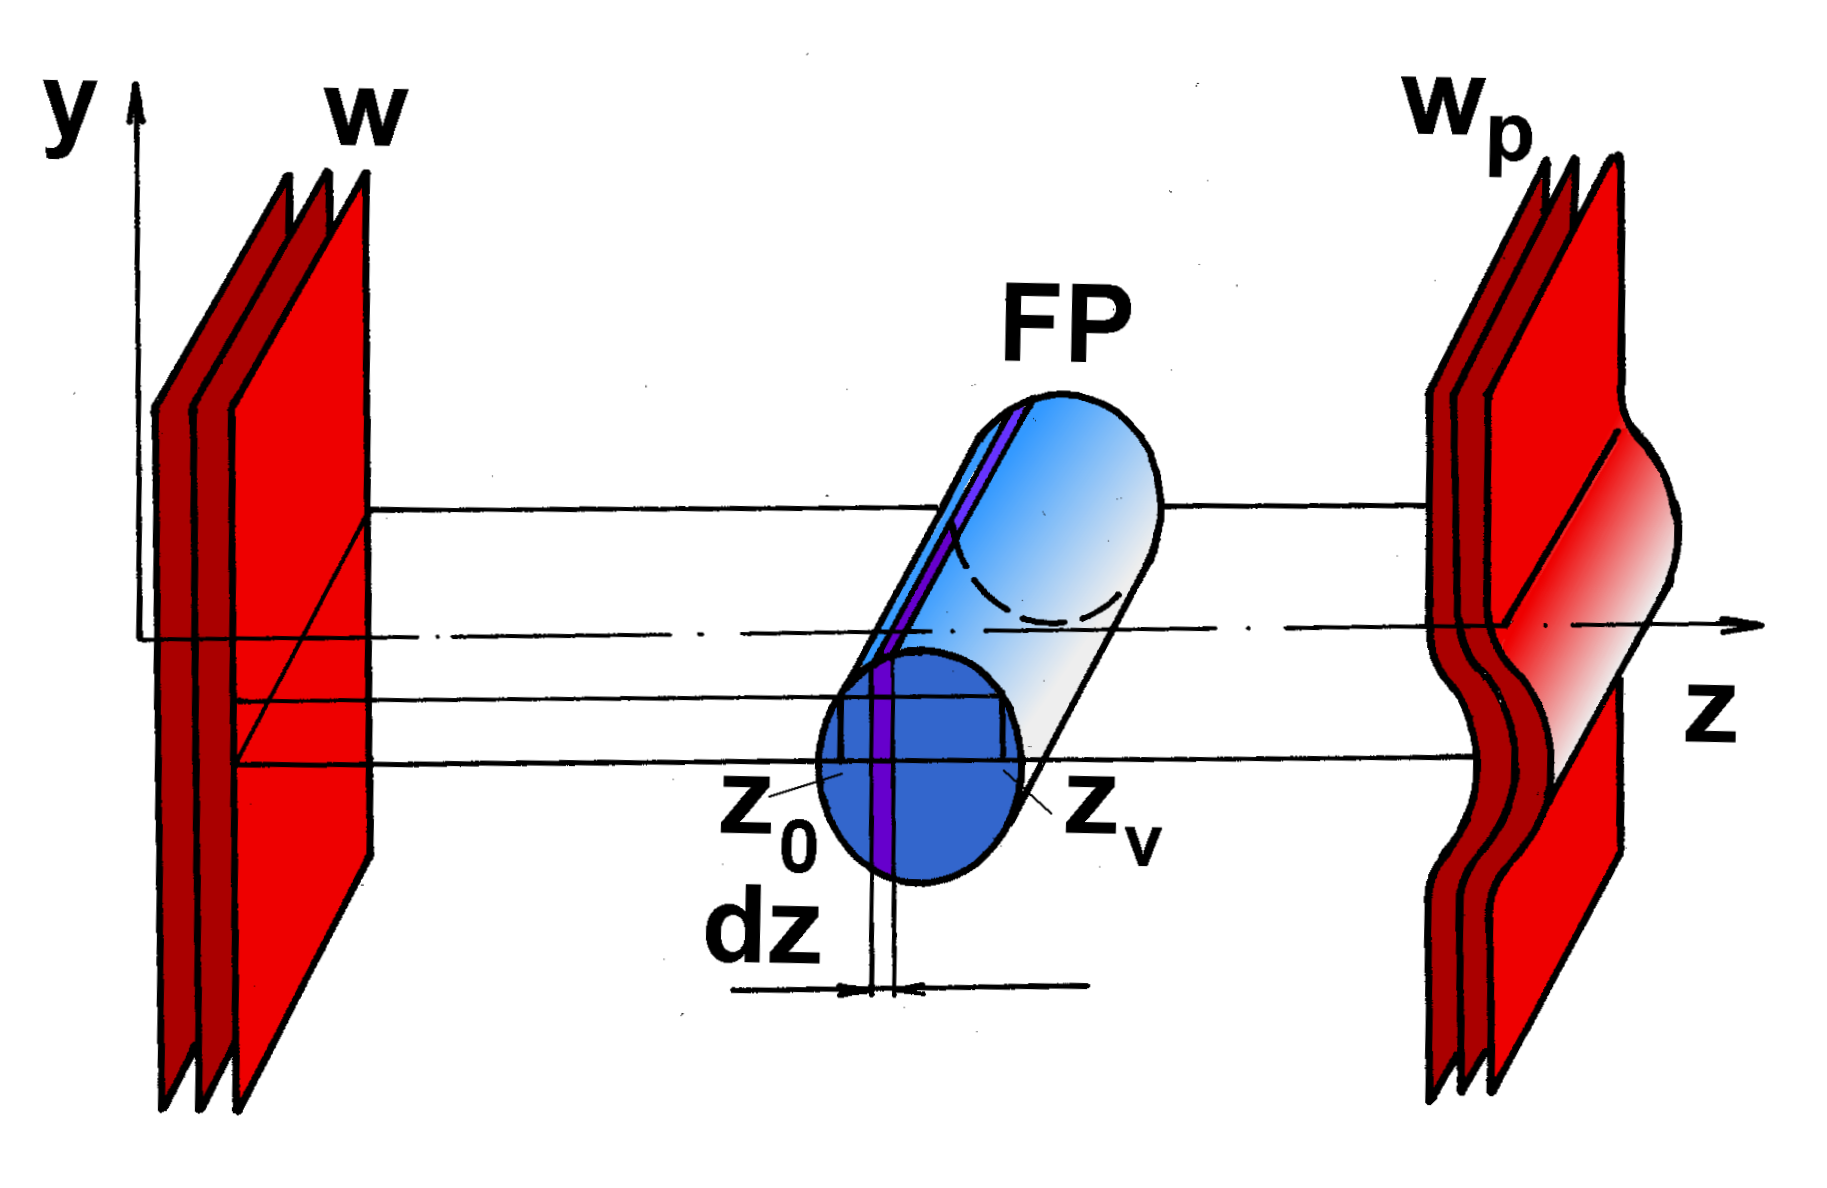
1 – phase object, w – planar wavefront, wp – deformed wavefront,
z0(y), zv(y) – z-coordinates limiting the phase object in height y
In the place with higher temperature the refractive index is different and the light wave is deformed. The planar light wave with wavefront w propagates in z-axis direction. Although the refractive index distribution in the phase object is generally not uniform we can define a such a thin layer of inhomogenity where it is possible to assume a constant refractive index. This layer causes the phase change.
If the optical inhomogenity does not act, the interference structure is created by a system of interference fringes parallel with the x–axis. The interference fringes are created due to phase difference between the object and reference waves as a result of different wave propagation directions (Hauf, Grigul, 1970). Such an interferometer set-up is called the adjustment to the finite fringe width (Fig. 3–53). At the beginning of the investigated phenomenon the fringes are adjusted into the position appropriate for quantitative analysis. During the experiment deformation of the fringes caused by physical changes of the phase object (density, temperature, concentration) occurs. The structure of the fringes is deformed according to the value of the phase change caused by the object in the individual places of the space. The change is determined from the interference fringe displacements.
a)b)
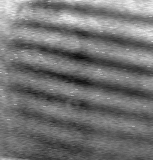
Fig. 3–53 Holographic interferogram of candle flame recorded by interferometer, adjusted to the finite fringe widtha) without heating
b) during the heating the interference fringes are deformed
The interferometer is
possible to adjust also to the infinite fringe width
(Fig. 3–54). The propagation directions of both
waves are then identical and, unless the phase object acts, the
resultant light field will have the same intensity because both waves
will be incident on plane y, x in identical direction.
The effect of the phase object is manifested by formation of
interference fringes.
a)b)
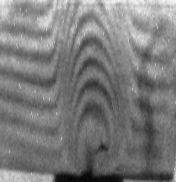
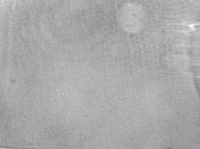
Fig. 3–54 Holographic interferogram of candle flame recorded by interferometer adjusted to the infinite fringe width(parallel position of the interferometric mirrors)
a) without heating the whole surface is equally illuminated
b) during the heating interference fringes are created
At the beginning of the observed phenomenon there is either one or none interference fringe on the investigated object. During the experiment under the influence of mechanical or physical loadings interference fringes are created whereas the number of interference fringes is the higher the larger are the temperature or concentration gradients or the mechanical load.
In Fig. 3–53 and Fig. 3–54 either formation or displacements of interference fringes are possible to observe. They are proportional to the phase change of the object wave in real time compared to the phase of the object wave reconstructed by the hologram. This change corresponds with the difference between the optical paths of the interfering beams (Urgela, Osvald, 1993). Thus the phase change caused by optical inhomogenity related to such parameters as density, temperature or concentration is determined.
Note: The adjustment of the interferometer to either finite or infinite fringe widths is possible to utilize also to observe diffusively reflecting objects.


