Results_and_Discussion2
3.2.3.2 Results and Discussion
The interpretation method used during the analysis was based on interference fringe counting method. For the first time it was suggested by Alexandrov and Bonč-Brujevič (Aleksandrov, Bonč-Brujevič, 1967).
This method is based on the fact that the fringes are located in the assigned distance from the surface of the reconstructed image. The viewing directions change gradually according to the view line (V1V2) through the hologram. By the fringe counting method (Fig. 3–39) we determine the number of fringes (N) that pass through a certain point of the object surface when the viewing direction is changed.
During the reconstruction, the hologram was illuminated only by the reference wave from one direction and consequently photographed from two viewing directions (V1, V2) whereas the coordinates of the camera objective focus (x, y, z) were measured as well. By taking photographs of the holograms, we obtained the data for both the interpretation of the holograms and the analysis of the thermal deformation. The distribution on x, y and z axes gives the general shift of the viewing directions (x) necessary for the interpretation process. The photograph obtained from the hologram with the recorded interference fringes is displayed in Fig. 3–40.
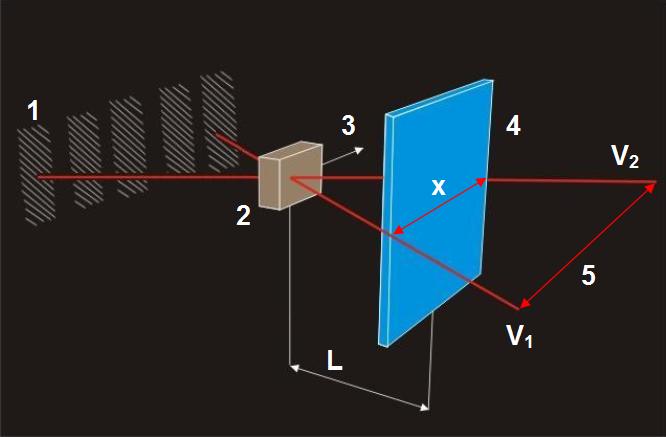
1 – fringes, 2 – image, 3 – displacement, 4 – hologram, 5 – viewing direction
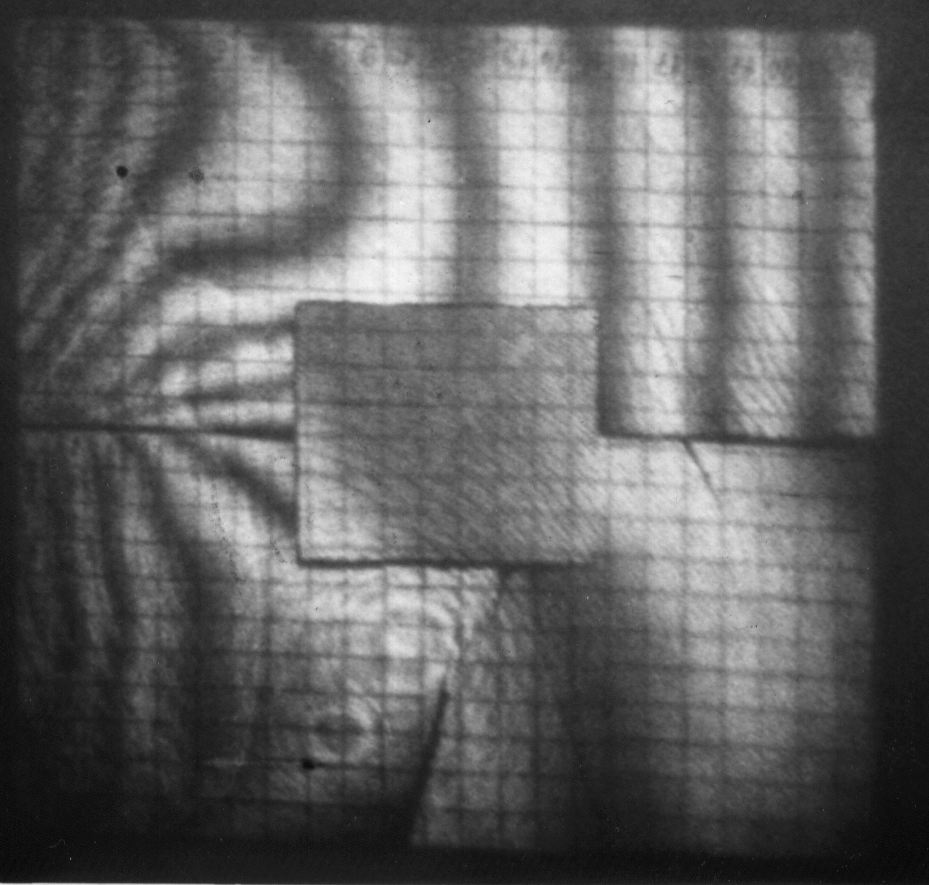
a) heating – viewing direction V1
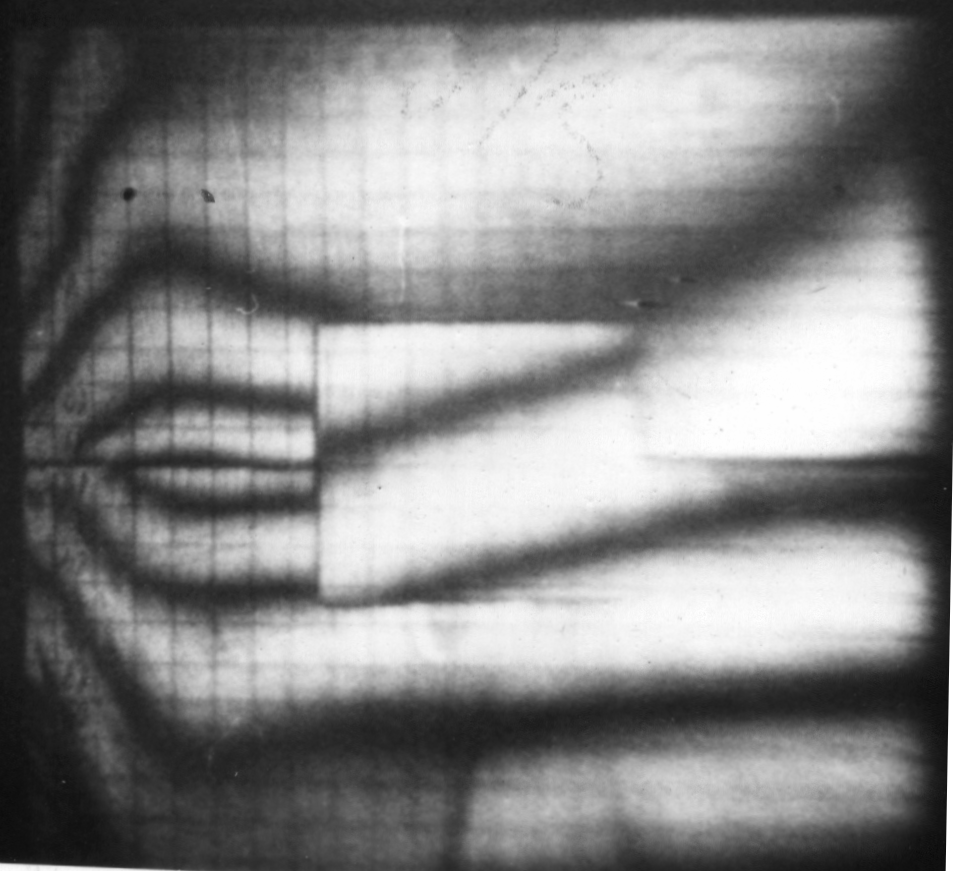
b) cooling – viewing direction V2
In the holographic interferometry, the shapes of visible fringe patterns depend on both the displacement of the body surface point and the viewing direction in the process of image reconstruction. If we use the photographs obtained (or the holographic images recorded directly to the CCD camera receptor) we can directly study the time dependence of the thermal deformation on the joint recorded on the fringe pattern. The interference fringes recorded on the interferograms were graphically distributed and analysed by recording their frequency, displacement and density. This process was recorded for two different viewing directions V1 and V2 and consequently analysed.
From the two recorded images obtained from two different viewing directions on the same hologram, the optical record of the displaced fringes was made. The deviation in direction x, corresponding to one steady point (thermoelement 1) of each interferogram was analysed.
 , (3.61)
where
dx– calculated deformation,
N – number of fringes passing through a particular point,
λ – wavelength of laser beam => λ = 632 nm,
L – distance of the reconstructed image from the hologram,
X – distance recorded through the hologram.
Besides taking photographs the holographic images were also recorded through a CCD camera into the computer, where the positions and displacement directions of the interference fringes were determined by relevant software.
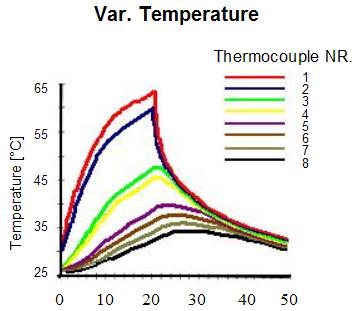
Besides thermal deformation, time and spatial dependences (direction x) of the thermal flow through the wood joint were also analysed. During the recordings on the holographic plate more data were also obtained by means of thermo-elements. The electromotive force recorded for each thermo-element and each time interval was converted into temperature. From these converted data the time dependency of temperature changes in the wood joint (Fig. 3–41) was then determined for each thermo-element. The results illustrate (through the solution of the Fourier equation for heat transmission) how much heat can be absorbed and radiated by the test specimen during the process of thermal flow.
From the results corresponding with the thermal deformation and temperature changes in the wood joint we analysed the thermal deformation as well as the function of temperature changes for direction x. As the measurements were time dependent, it was necessary to determine the temperature change interval corresponding with the average displacement recorded on each hologram.
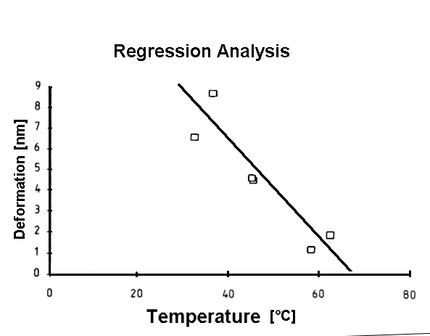
The thermal deformation data were used for both the regressive analysis and the analysis of variability to determine the dependence of deformation on temperature. With these analyses reliable results and better understanding of thermal deformation as a function of temperature changes were reached. The obtained results show the high correlation coefficient (92 %) between the changes of temperature and the original (direction x) thermal deformation (Fig. 3–42).
The results obtained manifest the appropriateness of the used holographic method for the analysis of deformations induced in wood joints. Even if the analysis was realised only for one direction (x) not taking into consideration three-dimensional thermal deformation of wood, the results reached are of considerable importance. This method comes into force mainly if the deformations are very small and cannot be measured or recorded by conventional methods. Since it is a non-destructive method, measurements by holographic interferometry bring us very high accuracy and reliability.


